Ethnicity Pay Gap Statistics - March 2025
Unlike the gender pay gap there is no legal requirement to calculate or disclose ethnicity pay gap data. However we have decided to calculate this to mark our commitment to diversity and inclusion.
Government has given advice on how to best to combine different ethnic groups to protect confidentiality and comply with the General Data Protection Regulation (GDPR) as it must not be possible to identify an individual. They state that for information that will be published externally a wise minimum category size (based on current good practice from publishers of statistics like the ONS) for each ethnic group would be 50 people.
As a relatively small employer we have therefore aggregated to two groups (binary reporting) as we have less than 50 employees who have identified as an ethnicity other than white. The profile of all our ethnic minority employees has been combined to ‘other’ which is a term short for ‘all other ethnic groups combined’ in line with Government advice on terminology.
What is a ethnicity pay gap?
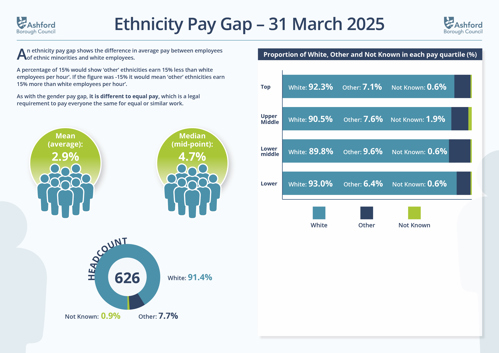
The ethnicity pay gap shows the difference in average pay between white employees and 'other' ethnicities.
A percentage of 15% would show ‘other’ ethnicities earn 15% less than white employees per hour’. If the figure was -15% it would mean ‘other’ ethnicities earn 15% more than white employees per hour’.
As with the gender pay gap, it is different to equal pay, which is a legal requirement to pay everyone the same for equal or similar work.
Our data - 31 March 2025
Mean (average) ethnicity pay gap in hourly pay: 2.9%
Median (mid-point) ethnicity pay gap in hourly pay: 4.7%
| Pay quartile | White | Other | Not Known |
|---|---|---|---|
| Top | 92.3 | 7.1 | 0.6 |
| Upper middle | 90.5 | 7.6 | 1.9 |
| Lower middle | 89.8 | 9.6 | 0.6 |
| Lower | 93.0 | 6.4 | 0.6 |
What do our calculations mean?
We have a small ethnicity pay gap for both average and mid-point calculations. As another reminder, this is not about equal pay.
Many of the ‘other’ ethnic employees we previously employed were professionally qualified – mostly in Port Health with a few higher paid earners in Legal and Planning. The recruitment that has been undertaken between 2024 and 2025 resulted in the lower middle and lower quartiles increasing in ‘other’ ethnicities which has been reflected in the calculations. Predominantly this is down to Port Health recruitment of ‘other’ ethnic employees as Technical Support Assistants (from 1 to 10 people) in these two quartiles.
The good news is that our headcount has increased by 15% and our ‘other’ ethnicities have increased by 26%: this equates to 7.7% of staff, up from 7% the year before.
The percentage of ‘other’ ethnicities in the top quartile has increased which is positive.
Previously 10.6% of employees had not disclosed their ethnicity (56 people) so we contacted them to advise why we collect this data, what we plan to do with it and why accurate data is needed to support targeted work that advances diversity and inclusion. Following this refresh the unknown percentage has been brought down to 0.9% (6 people).
Our pay structure, policies, recruitment procedures and training programme are set without bias to race or any other personal characteristic.
Here is a link to an infographic for our March 2025 statistics shown below